
Indoor Golf Simulator Data Analysis Tips
Table of Contents
- Why Golf Simulator Data Analysis Matters for Your Game
- Golf Launch Monitor Metrics You Need to Track
- Golf Simulator Data Explained: Reading Your Shot Breakdown
- Building Your Golf Practice Session Plan
- Indoor Golf Practice Drills That Use Simulator Data
- Common Mistakes When Analyzing Golf Simulator Data
- Reviewing Your Data: Frequency and Best Practices
- Frequently Asked Questions
Last Updated: October 17, 2026
Why Golf Simulator Data Analysis Matters for Your Game
Most golfers practice without real feedback. They hit balls, watch where they land, and move on. But that approach leaves massive gaps in your understanding of what's actually happening in your swing.
Golf simulator data analysis changes everything. It shows you exactly what your body is doing at impact, how the club is moving through space, and why the ball behaves the way it does. This isn't guesswork.
At Open Tee Golf in Wyoming, MI, members use Full Swing simulator technology to track every shot with military-grade accuracy. The data tells stories your eyes can't see.
The real power of golf simulator data analysis isn't in hitting one perfect shot. It's in building patterns. When you track your metrics across dozens of shots, you see what's consistent, what's broken, and where to focus your effort.
Golf Launch Monitor Metrics You Need to Track
A launch monitor measures what happens at the moment of impact. It captures data points that define your shot quality and consistency. Understanding these metrics is the foundation of smart practice.
Ball Speed and Distance
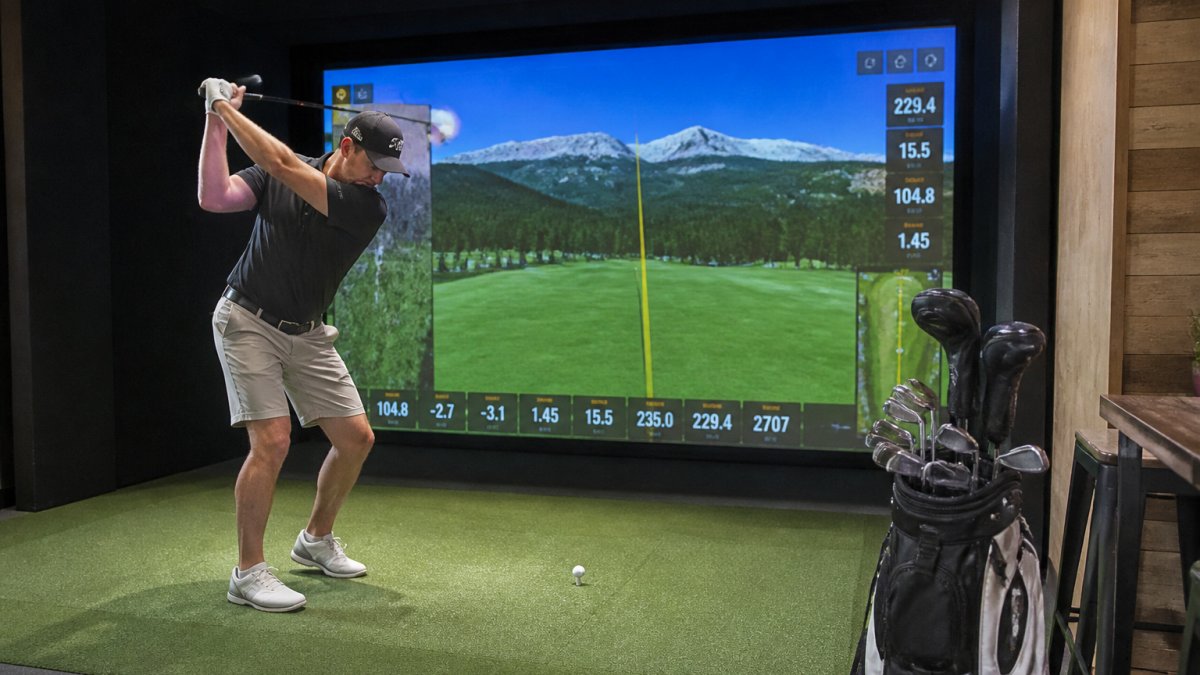
Ball speed is the velocity of the golf ball immediately after impact. It's measured in miles per hour. This number matters because it directly correlates with distance. A driver that produces 150 mph ball speed will travel farther than one producing 140 mph, all else equal.
Track your ball speed across multiple shots with the same club. Consistency is the goal. If your 7-iron ball speeds range from 85 to 95 mph, you have a swing inconsistency to address. Narrow that range, and your distances become predictable.
Distance is the end result. But don't chase distance alone. A shot that travels 220 yards with poor accuracy is less valuable than one traveling 210 yards in the center of the fairway. Use distance data in context with other metrics.
Launch Angle and Spin Rate
Launch angle is the vertical angle at which the ball leaves the clubface. Measured in degrees, it's critical for optimal distance. Too low, and you lose carry. Too high, and you sacrifice distance to excessive height.
Spin rate is the rotation of the ball in revolutions per minute. It affects trajectory, stopping distance, and consistency in wind. Higher spin rates create more control on approach shots. Lower spin rates help with distance on drives.
The relationship between launch angle and spin rate matters more than either number alone. A driver with 15 degrees launch and 2,500 rpm spin will perform very differently than one with 20 degrees launch and 3,500 rpm spin. Understand what your equipment and swing produce, then optimize from there.
Smash Factor and Clubhead Speed
Smash factor is the ratio of ball speed to clubhead speed. It tells you how efficiently you're transferring energy from the club to the ball. A smash factor of 1.48 on a driver is excellent. Below 1.40 suggests you're not making solid contact.
Clubhead speed is the velocity of the club at impact, measured in miles per hour. A faster clubhead speed generally produces more distance, but only if smash factor stays high. Swinging harder without improving contact quality wastes energy.
These two metrics work together. You can have high clubhead speed with poor smash factor (loose, inconsistent contact). Or moderate clubhead speed with excellent smash factor (solid, efficient strikes). The goal is both: solid contact with good speed.
Golf Simulator Data Explained: Reading Your Shot Breakdown
Every shot in a golf simulator generates a detailed breakdown. Understanding how to read that data transforms practice from aimless to purposeful.
Understanding Shot Dispersion Patterns
Dispersion is where your shots land relative to the target. Plot ten 7-iron shots, and you'll see a pattern. Some cluster tight. Others scatter. That pattern reveals your consistency level and your typical miss direction.
A tight cluster means repeatable mechanics. A scattered pattern means swing inconsistency. But even scattered patterns tell you something useful. If all your misses go right, your clubface is open at impact. If they go left, your path is out-to-in.
Track dispersion over time. After ten practice sessions, your pattern should tighten. If it doesn't, your swing changes aren't working. If it does, you're building consistency.
Comparing Baseline Data to Track Improvements
Establish a baseline first. Hit twenty shots with each club in a neutral environment. Record the average ball speed, launch angle, spin rate, and dispersion. This is your starting point.
Return to this baseline every two weeks. Compare new data to the baseline. Did your 6-iron ball speed increase? Did your driver dispersion tighten? Did your spin rates on approach shots improve?
Improvements are often small. A 2 mph increase in ball speed, a one-degree tighter dispersion pattern. But small improvements compound. Over three months, they become significant changes in your game.
Building Your Golf Practice Session Plan
Random practice produces random results. Structured practice produces improvement. A good session plan combines warm-up, focused work, and testing.
Defining Your Practice Goals Before You Start
Know what you're working on before you hit a shot. Generic goals like "improve my swing" are useless. Specific goals are actionable.
Good goals:
- Increase driver ball speed from 145 to 150 mph
- Tighten 7-iron dispersion to within ten yards
- Reduce 3-wood spin rate by 200 rpm
- Improve short iron consistency to 90% fairway hit rate
Each goal should connect to your game. If you struggle with approach shots, focus there. If your driving distance is inconsistent, work on clubhead speed and smash factor.
Structuring Warm-Up, Focused Work, and Testing
A solid session has three phases.
Warm-up (10-15 minutes): Hit easy shots with multiple clubs. Focus on feel, not data. Get loose. Get comfortable with the simulator.
Focused work (20-30 minutes): Target one specific goal. If you're working on driver ball speed, hit drivers. Adjust your swing based on the data feedback. Make small changes. Test each one.
Testing (10-15 minutes): Simulate course conditions. Hit a nine-hole round or a series of pressure shots. See how your improvements perform under realistic conditions.
This structure prevents burnout and keeps practice purposeful. Members at Open Tee Golf in Wyoming often follow this framework to maximize their 24/7 access.
Indoor Golf Practice Drills That Use Simulator Data
Drills convert data into skill. They give you specific targets and clear feedback.
Consistency Drills: Repeating Your Target Metrics
Pick one metric. Set a target. Hit shots until you hit that target consistently.
Example: Driver consistency drill.
- Target: 150 mph ball speed, 2,800 rpm spin rate
- Hit ten drivers
- Count how many hit both targets
- Goal: eight out of ten
Repeat this drill weekly. Track your success rate. As it improves, your swing becomes more repeatable.
Another example: 7-iron accuracy drill.
- Target: Dispersion within ten yards of center
- Hit fifteen 7-irons
- Count how many land in the target zone
- Goal: twelve out of fifteen
These drills build muscle memory and consistency. Data tells you immediately if you've succeeded.
Progressive Distance Drills with Data Feedback
Start with a baseline distance. Gradually increase it while maintaining accuracy.
Driver distance progression:
- Week one: Hit ten drivers, target 220 yards, 70% accuracy
- Week two: Hit ten drivers, target 225 yards, 70% accuracy
- Week three: Hit ten drivers, target 230 yards, 70% accuracy
The data shows whether you're improving distance without sacrificing accuracy. If accuracy drops below 70%, stay at the current distance until you rebuild consistency.
Pressure Testing and Course Simulation
Simulate real course conditions. Play a nine-hole round. Track your score. Compare your performance metrics to your practice baseline.
Did your metrics stay consistent under pressure? Or did they degrade? This reveals whether your improvements transfer to actual play.
Play the same nine holes weekly. Watch your scores improve as your swing consistency improves. This is where practice meets real-world results.
Common Mistakes When Analyzing Golf Simulator Data
Data is powerful. But it's easy to misuse it. Avoid these traps.
Chasing Single Shots Instead of Patterns
One perfect shot means nothing. Five perfect shots in a row means something. Ten perfect shots means you've found a pattern.
Don't obsess over individual results. Look at trends. If your last shot was great but your previous ten were inconsistent, you got lucky. Focus on the pattern.
This is why tracking data over multiple sessions matters. One session of good data is noise. Three sessions of improving data is a trend.
Ignoring Club-Specific Baselines
Your 7-iron doesn't perform like your 6-iron. Your driver doesn't perform like your 3-wood. Each club has its own baseline metrics.
A 7-iron ball speed of 95 mph is normal. A driver ball speed of 95 mph is terrible. Don't compare metrics across clubs. Establish baselines for each club individually.
Track improvements within each club. Did your driver ball speed improve? Compare this month's driver data to last month's driver data, not to your 7-iron data.
Making Swing Changes Too Frequently
Your brain needs time to adapt to swing changes. If you change your swing every session, you never build consistency.
Make one change. Practice it for at least five sessions. Let your body learn the new pattern. Then evaluate the data.
If the data improves, keep the change. If it doesn't, revert and try something different. But give each change time to work.
Reviewing Your Data: Frequency and Best Practices
Regular review keeps you accountable and focused.
Review your data weekly. Look at:
- Average metrics for each club
- Consistency (how tight is your dispersion?)
- Trends (are metrics improving or declining?)
- Correlation (do your improvements on the simulator translate to better scores?)
Monthly, compare this month to last month. Are you trending in the right direction? Are your goals getting closer?
Quarterly, step back and reassess. Are your original goals still relevant? Have you achieved them? Time to set new ones.
This rhythm keeps practice intentional. You're not just hitting balls. You're building measurable improvement.
Improving your golf game requires more than just practice time. It requires understanding what your swing is actually doing, identifying specific areas to improve, and tracking progress over time. Golf simulator data analysis gives you that clarity.
At Open Tee Golf in Wyoming, MI, our Full Swing simulators provide the precision data you need to practice smarter.
PGA Tour professionals use launch monitor data as a core part of their training, and now you can too. Start tracking your metrics today and watch your game improve.
Frequently Asked Questions
Which golf simulator data should beginners track?
Start with ball speed, launch angle, and total distance. These three metrics reveal whether your swing is generating enough energy and whether your club is striking the ball at the right angle. Once you're comfortable interpreting these, add spin rate and smash factor. Tracking too many metrics at once overwhelms most beginners; focus on one or two per practice session until the data becomes intuitive.
How accurate is indoor golf simulator data compared to real course conditions?
Full Swing simulators use military-grade shot tracking technology that captures ball flight physics with high precision. The data translates directly to real course performance because it measures actual physics (ball speed, launch angle, spin). However, simulator greens may play slightly differently than outdoor turf. Use simulator data to refine your swing mechanics and consistency, then validate your improvements on the course.
How can I tell whether a change in my swing is actually helping?
Collect baseline data on your current swing across 10-15 shots with each club. Record average ball speed, launch angle, and dispersion. After making a swing change, hit another 10-15 shots and compare the averages. Real improvement shows consistent shifts in your target metrics, not just one or two good shots. If your average ball speed increases by 2-3 mph or your dispersion tightens, the change is working.
What's the best way to structure an indoor golf practice session using simulator data?
Begin with a 5-10 minute warm-up hitting shots with your most comfortable club to establish baseline metrics. Move into focused work on a specific goal (e.g., improving launch angle with your 6-iron) for 20-30 minutes. Finish with pressure testing or course simulation for 10-15 minutes. End by reviewing the session data to identify patterns. This structure balances skill development with confidence-building and gives you clear data to analyze afterward.